From Raw Order Data to a Logistics Command Center
Diagnosing delivery, cost, and seller performance across 100K+ e-commerce orders.
Note: built on the public Olist Brazilian E-Commerce dataset, not a live ARES client engagement — shown in full, end-to-end, so you can verify the methodology yourself before trusting us with your own numbers.
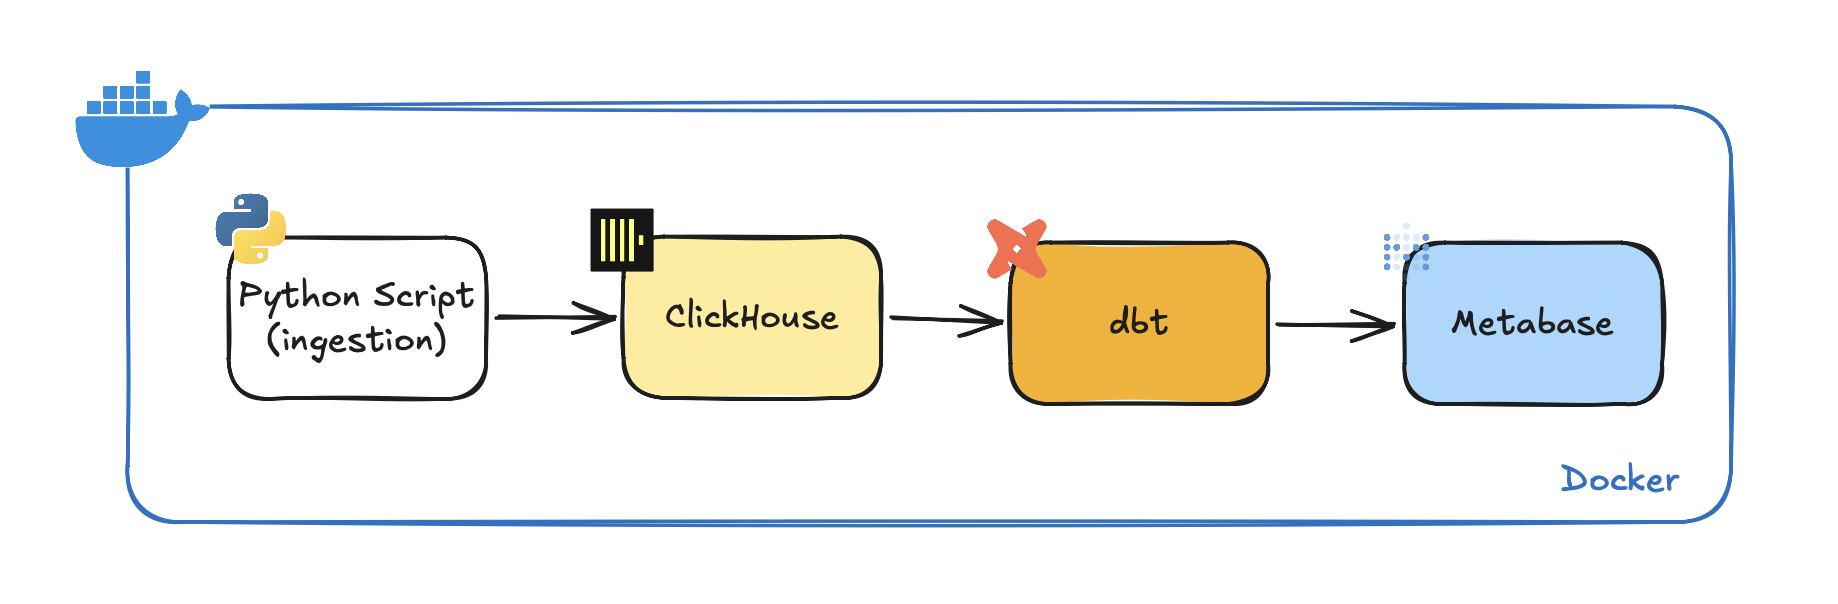
A growing e-commerce marketplace had order, delivery, freight, seller, and review data scattered across raw exports — no single place to answer: How is logistics performing? Where are the problems? Why are they happening?
Ingestion
9 raw source tables loaded verbatim into a ClickHouse warehouse, zero transformation at landing.
Transformation (dbt)
26 models across staging → intermediate → marts, every boundary enforced with automated tests (unique, not_null, relationships, accepted_values) plus custom business-rule tests.
Business logic, computed once
Delivery severity, freight ratios, seller performance, and a composite Logistics Performance Score — reused across every dashboard so the numbers never disagree with each other.
Visualization (Metabase)
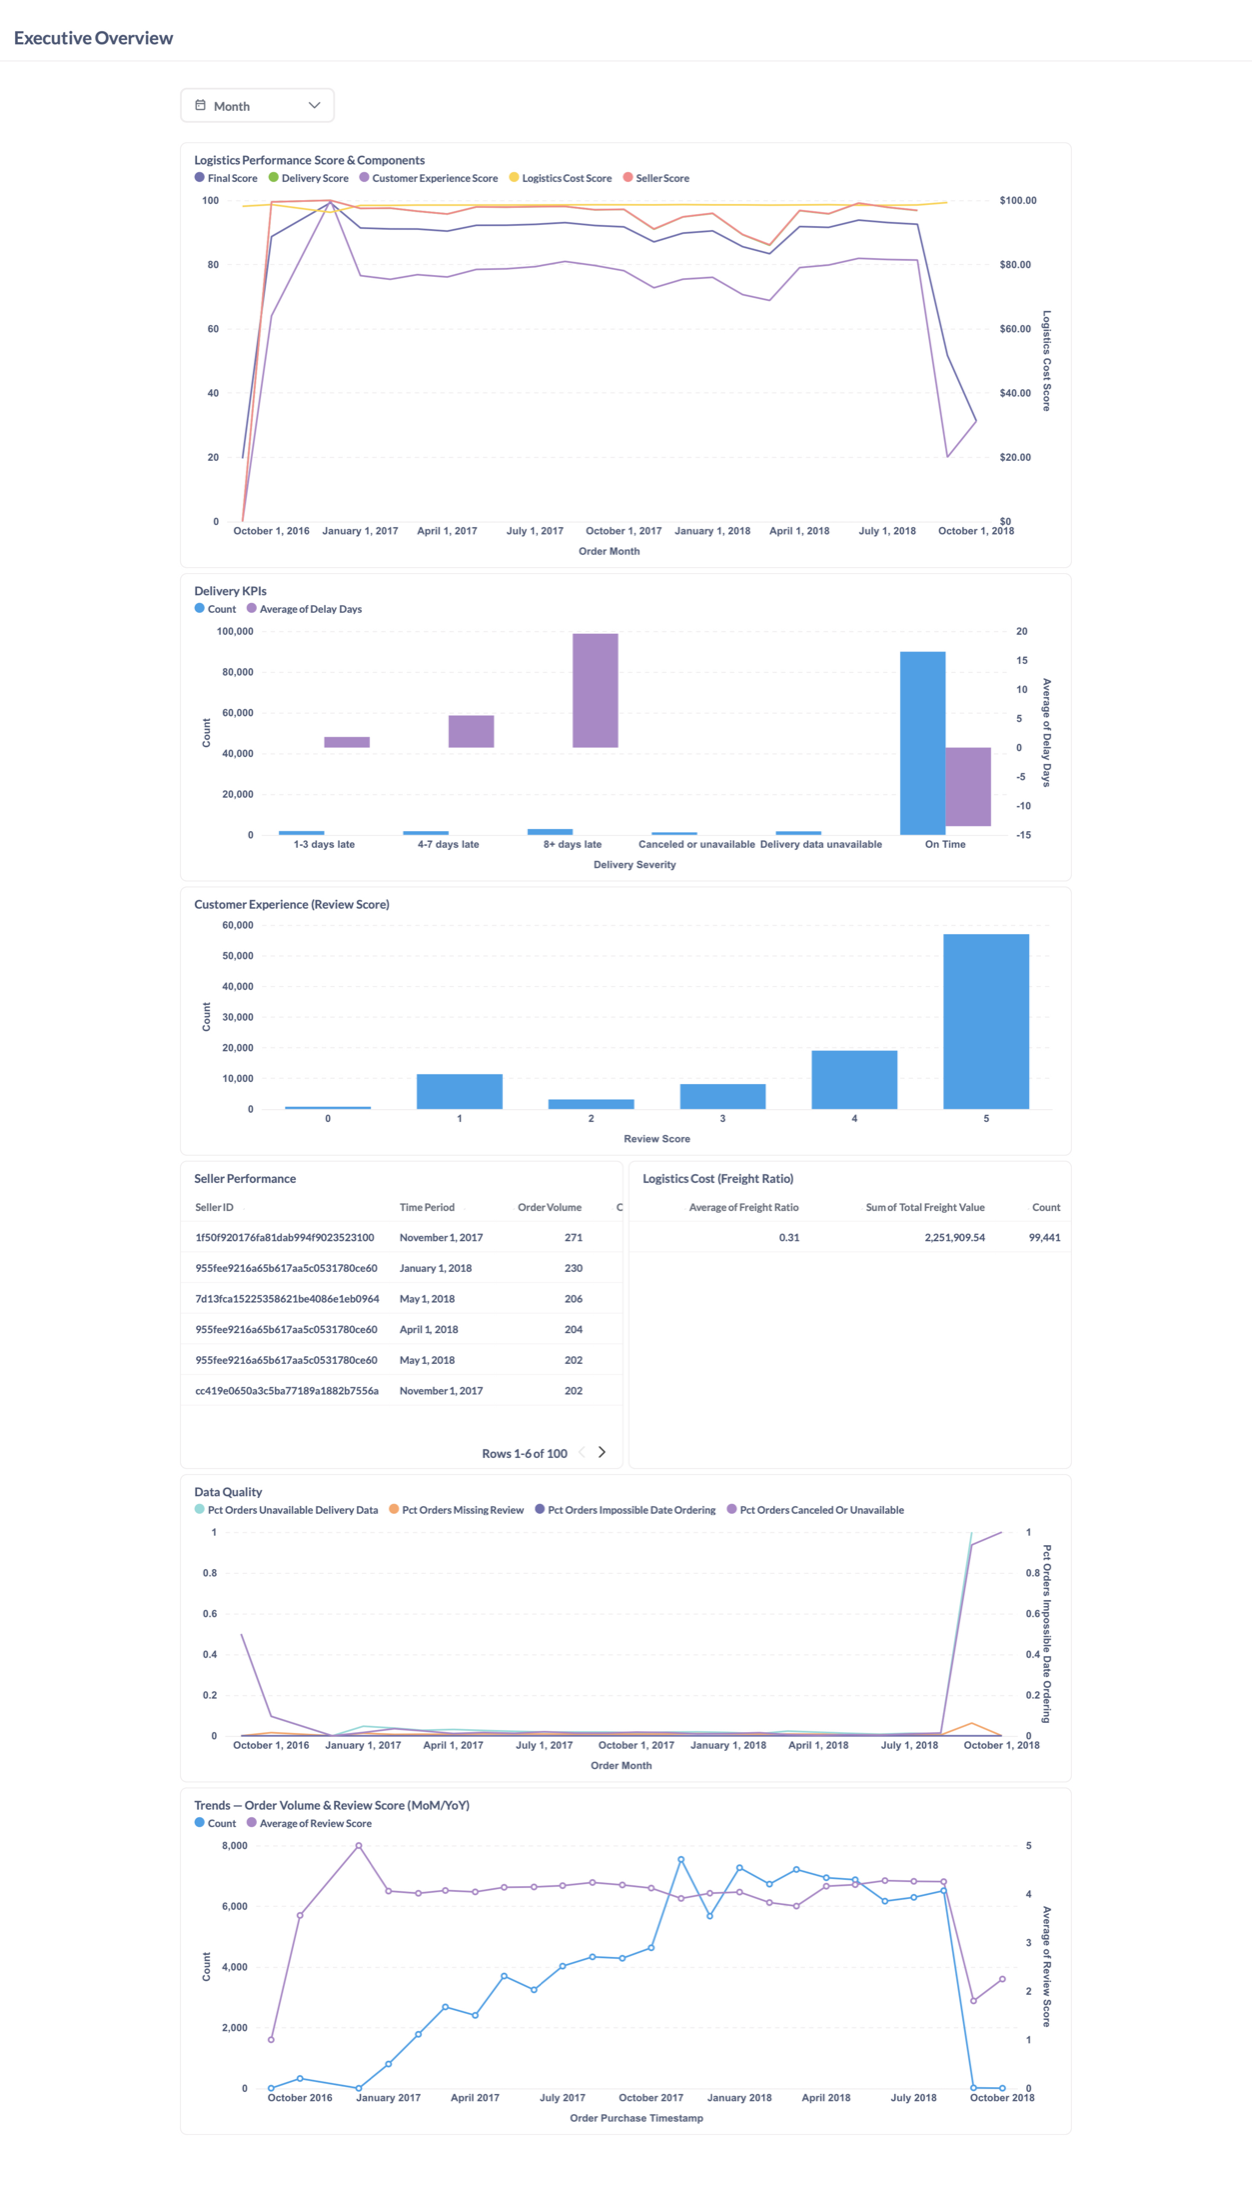
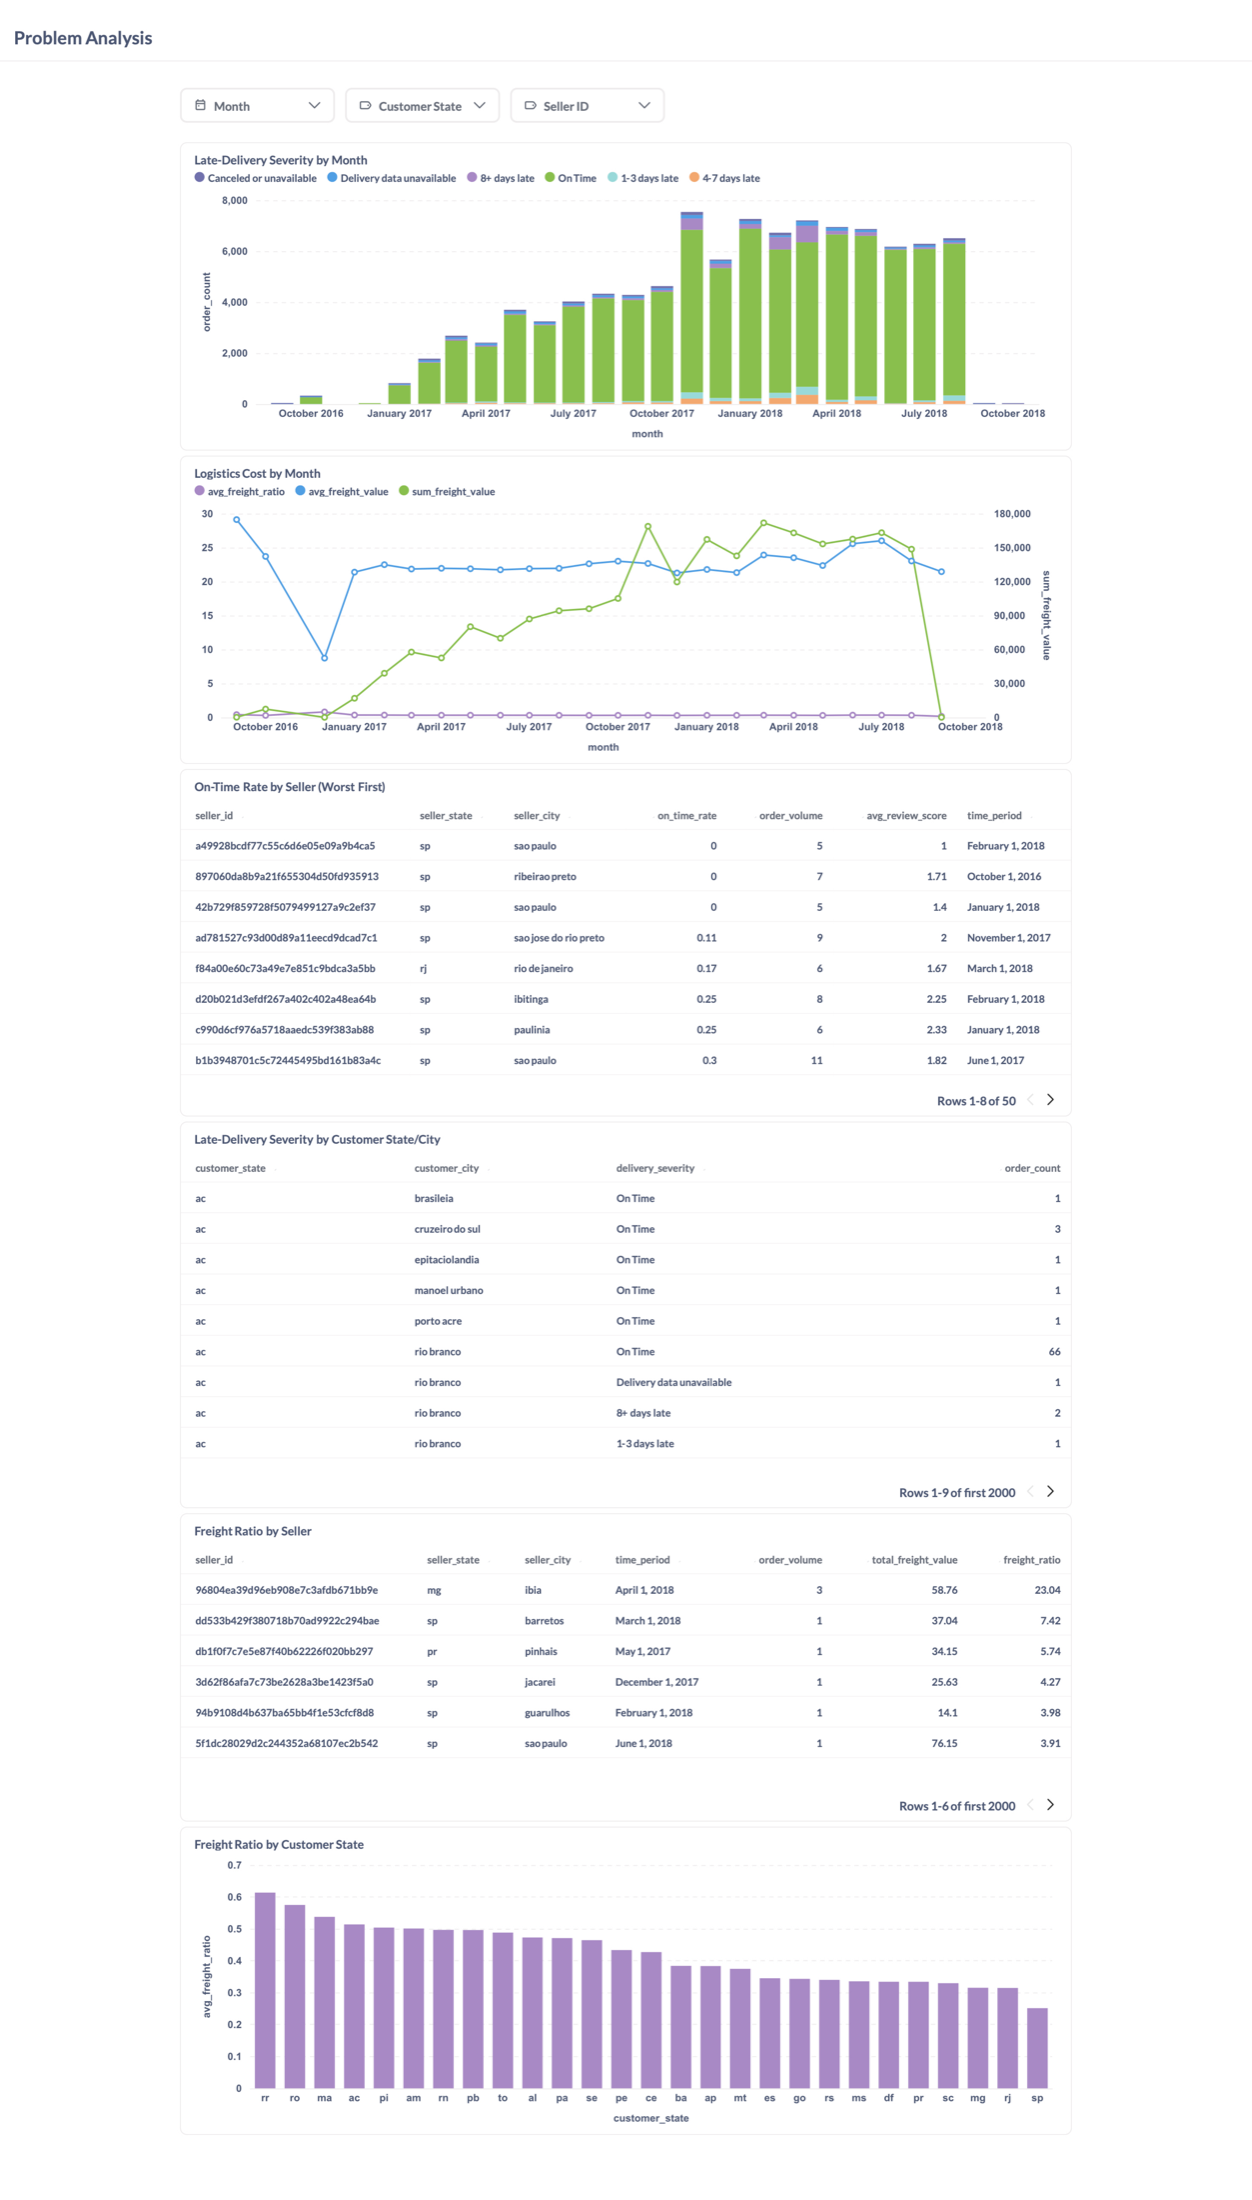
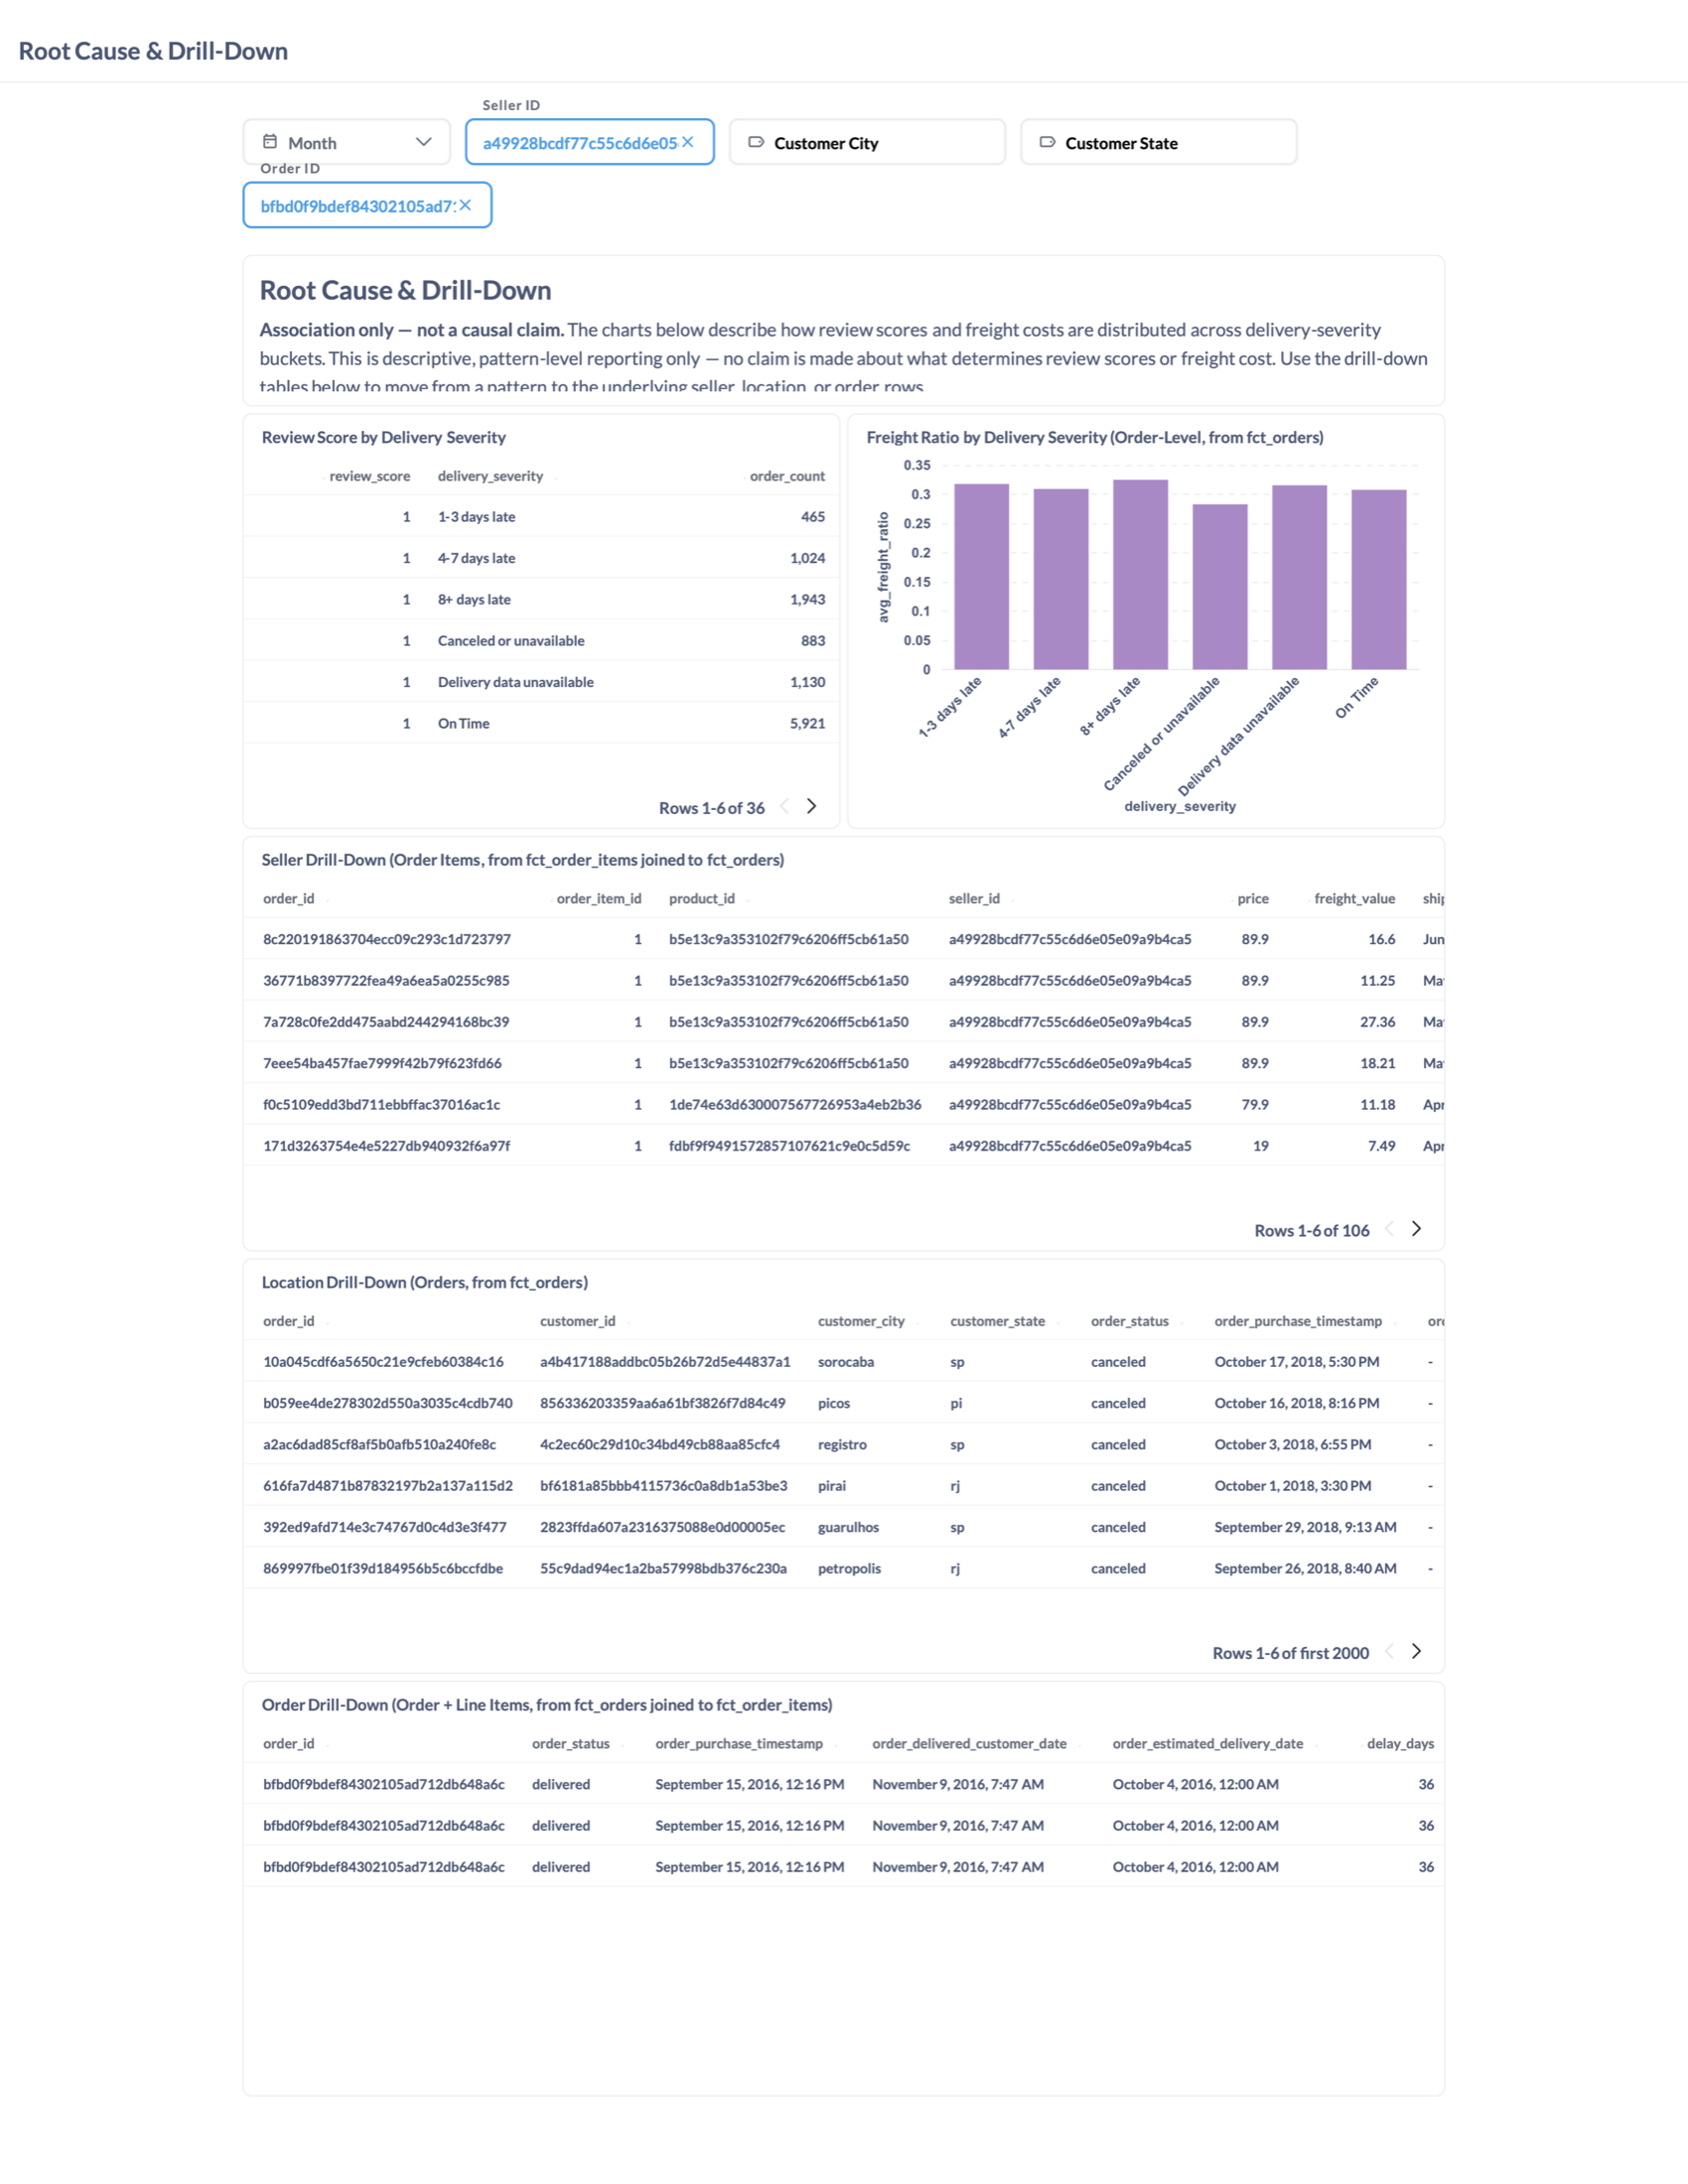
3 dashboards following the real decision flow: How are we doing? → Where's the problem? → Why is it happening?
Reproducible by design
The whole stack runs locally via one docker compose up. No cloud credentials, no stale demo link — a reviewer can clone it and run the real pipeline.
84.3/100
Composite Logistics Performance Score
Customer Experience was the real drag, not delivery or cost.
90.4%
On-time delivery, platform-wide
But a long tail of underperforming sellers — as low as 64.6% on-time — gave a short, actionable list.
5–7x
Higher late-delivery rates by geography
States far from the fulfillment hub saw 4+ day-late rates 5–7x higher than top performers — geography, not sellers, explains most late deliveries.
~0%
Freight cost impact on lateness
Freight ratio barely moved between on-time and 8+ day-late orders, ruling out cost as the root cause.
2.6★
Review swing from on-time to 8+ days late
Delay severity tracks tightly with customer reviews — from 4.29★ on-time to 1.70★ at 8+ days late.
This is the same diagnostic ARES runs for retail and e-commerce founders: connect the scattered systems, compute the metrics once, and answer where the money, time, or trust is leaking — in weeks, not months, without an in-house data team.
Stack
ClickHouse · dbt · Metabase · Docker Compose · Python
Repo
github.com/cancinoray/ecommerce-logistics-analytics